Track160 is an automated football analytics product in an all-in-one desktop platform, which includes. Highly accurate tracking and performance data, automated video analysis, and sport science information.
I joined the project after the initial research and the creation of the basic core of the Design System. Using the Agile method of working, my role was to continue the construction and, development of, the main and new directions of the product.
ROLE Product Designer
METHODS Competitive Analysis, Usability Studies
TOOLS Sketch, Illustrator, Photoshop
PRACTICES UX & UI Design, Prototyping, Validation
Discovery
Comparative Advantage Track160 offers performance data for teams, individual players, or squads from either side of the field. The product has the ability to explore different parameters such as position, squad compactness, passing networks, distance, acceleration, deceleration, and sprints. None of the competitors offer such a robust toolset with such an accurate dataset.
Available Metrics Competitors offer a lot of data, but none of it is organized or relevant to the user, be it the coach, sports scientist, or fitness coach. So, our top priority was to offer contextualized data and avoid overwhelming the user with “nice to have” statistics and data.
Sport Science The report is different from simple Player Performance analysis. The key here is looking at and showing the same data from different angles. Track160’s product needs to help coaches reach tactical insights, sports scientists to learn new insights, and fitness coaches to train better players.
Pain Points and Solutions
Track160 users have no problem getting accurate information and data with a “low” number of data points. Their competitors have similar, abilities, but the main challenge is how to find ways to highlight the most important elements within this mass of information and make them stand out and to have this data at the user’s disposal so he or she can turn it into actionable solutions.
Based on all of the findings I narrowed the focus into 3 areas for potential improvement of the dashboard:
− Rearranging the data and statistics display − Improving navigation − Improving notification
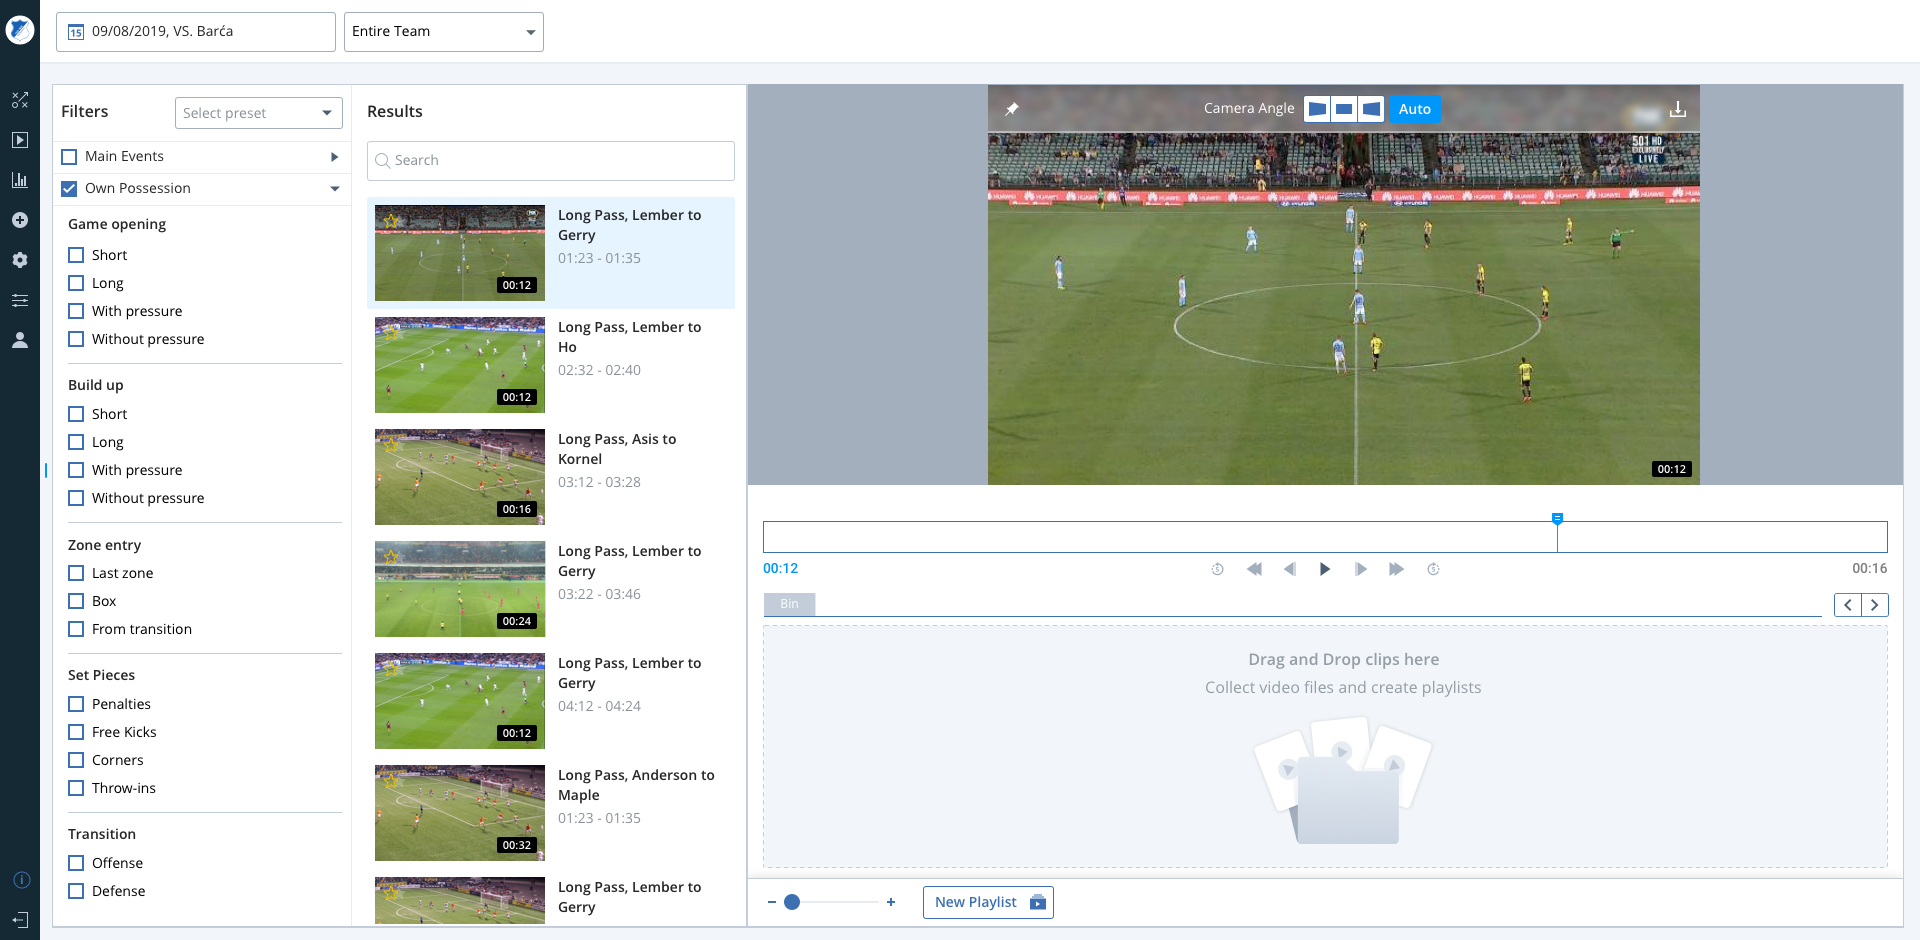
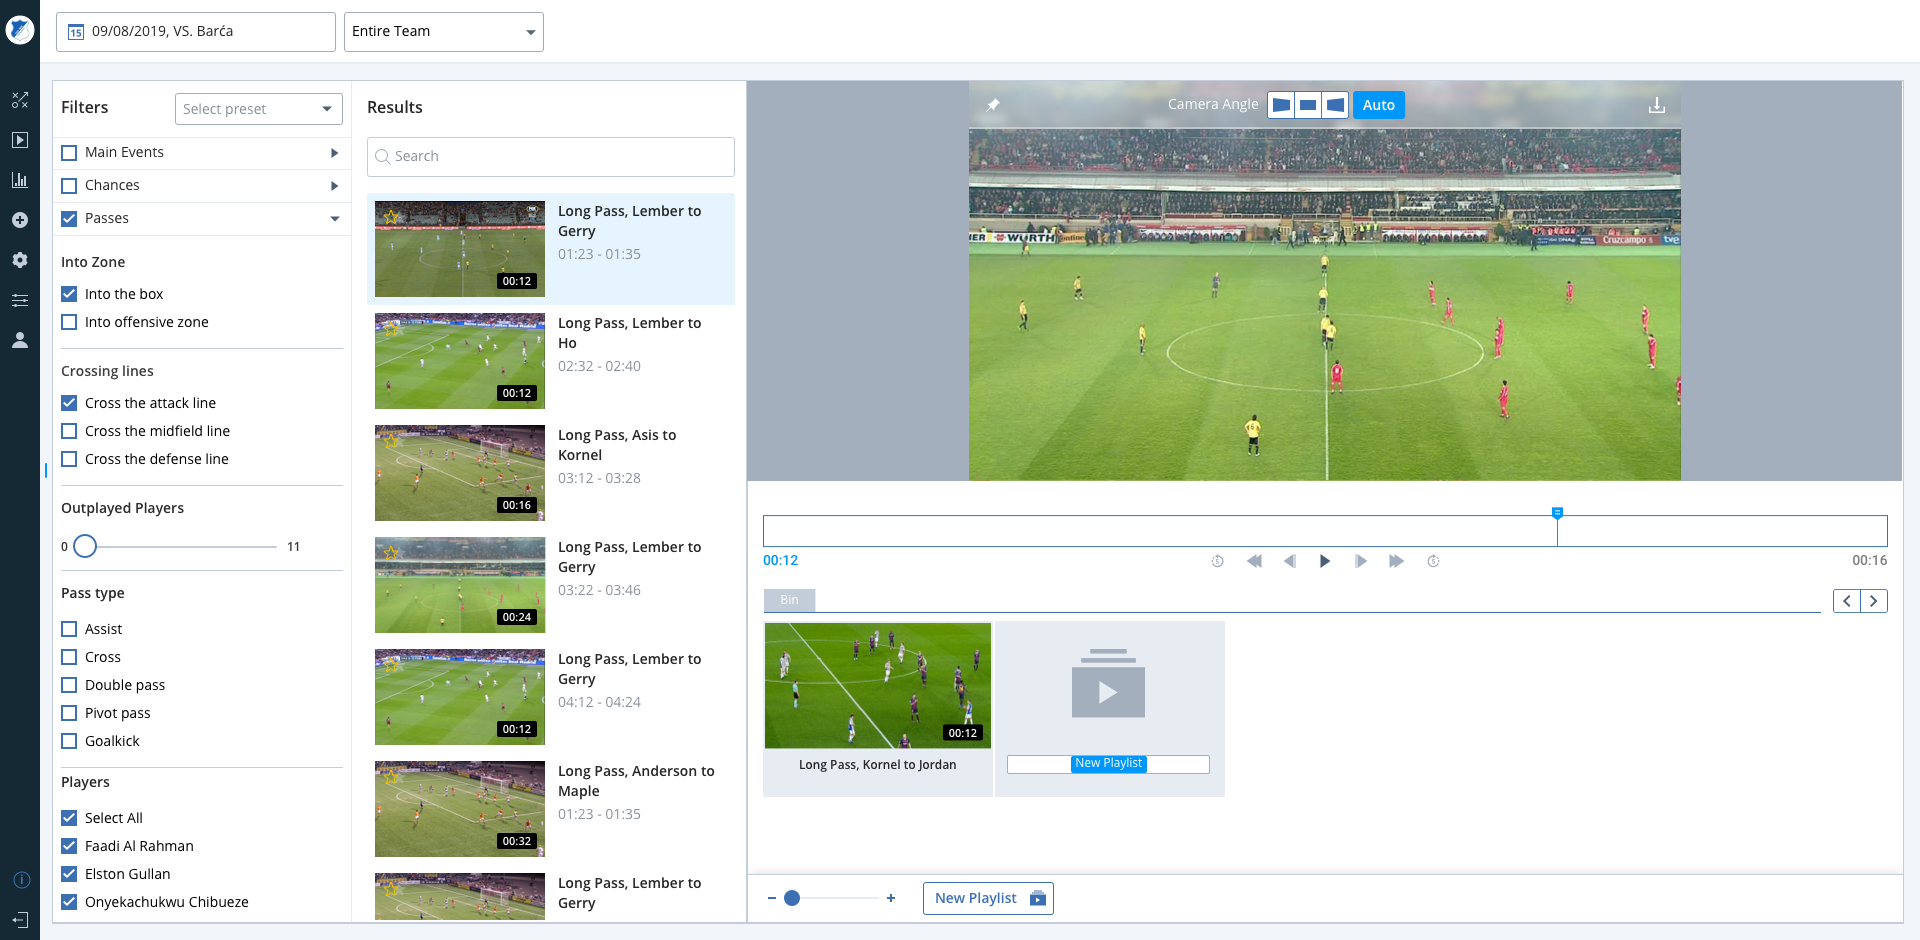
An example of a screen for organizing the working environment of a web application: dynamic filters, video gallery, camera settings, and video player with editing tools.
Video Analysis. Creation of New Preset. Default screen
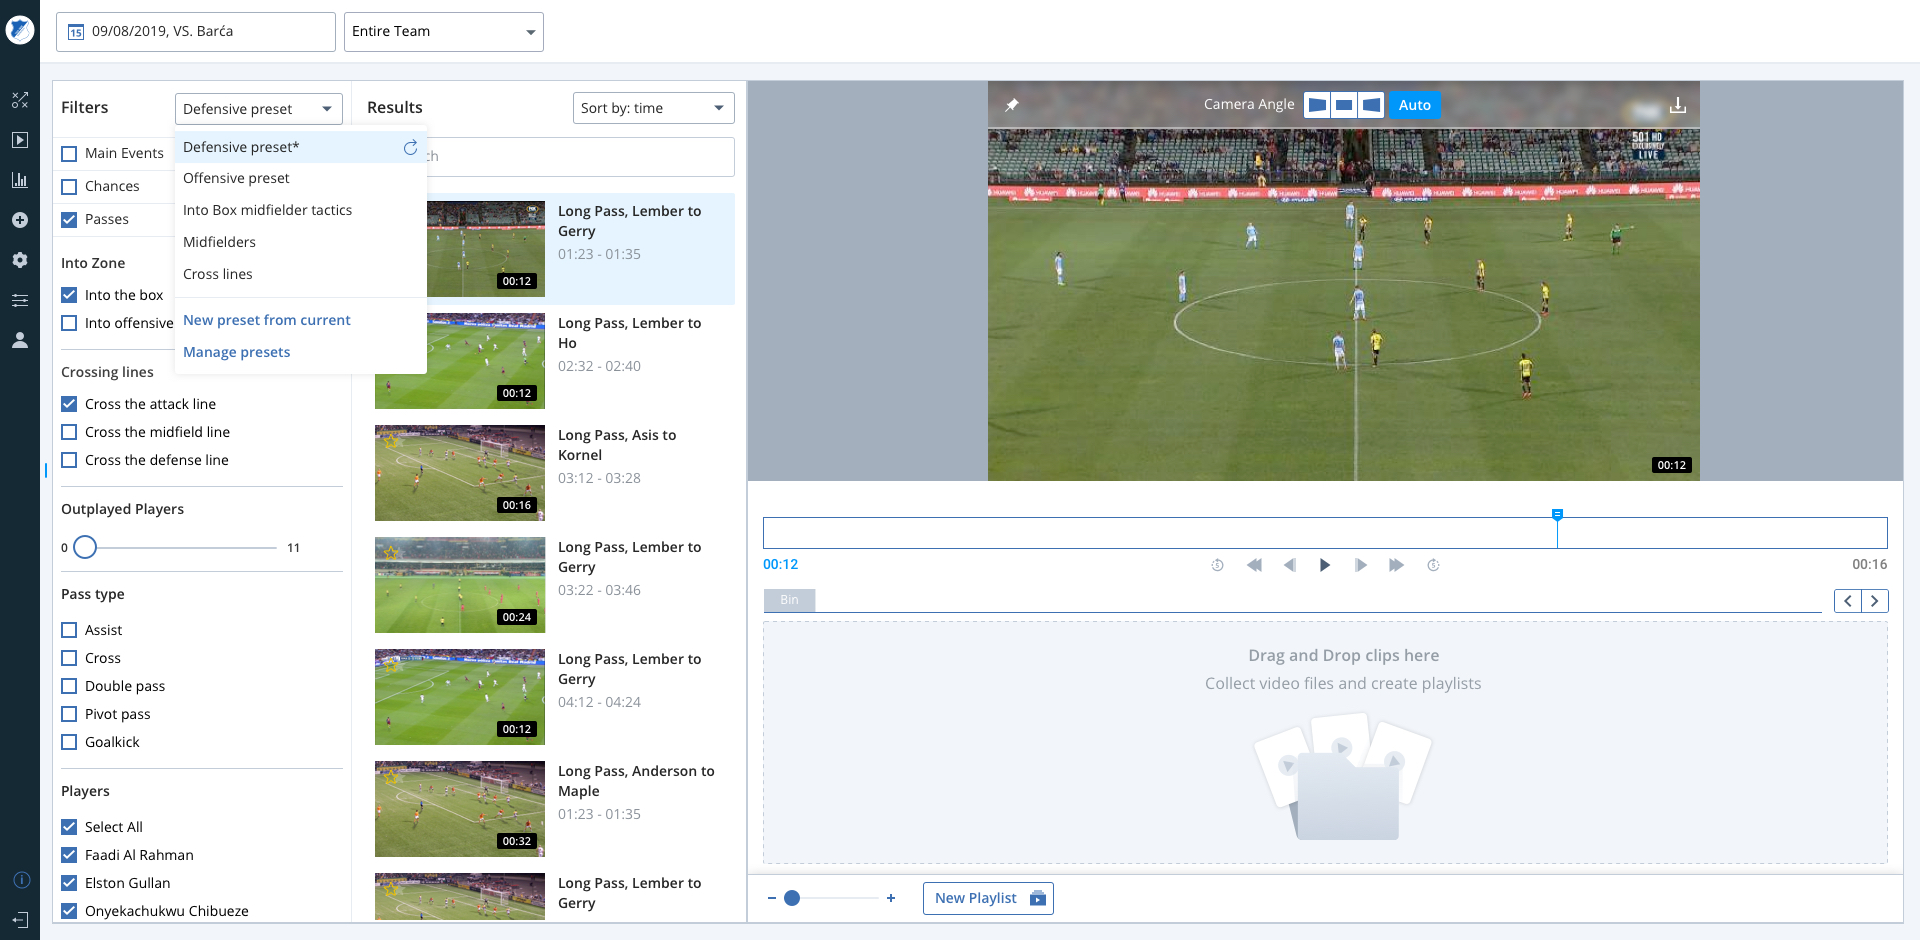
Video Analysis. Creation of New Preset. Dropdown
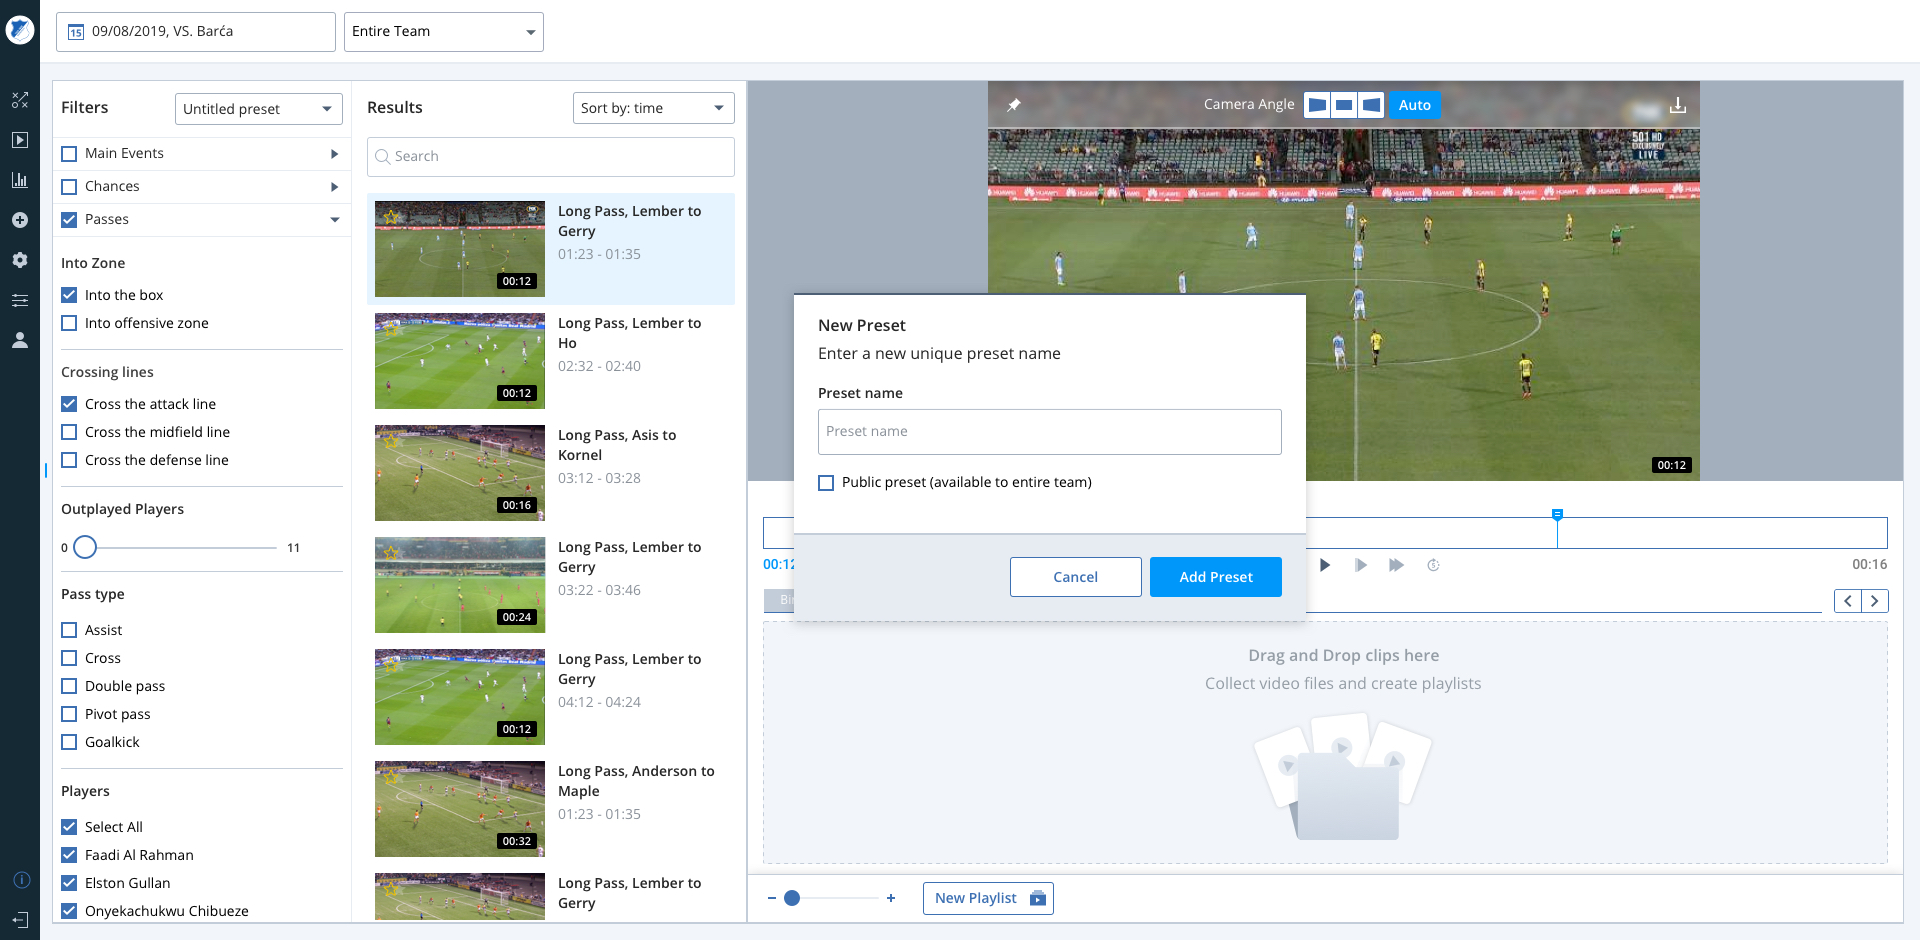
Video Analysis. Creation of New Preset. Modal
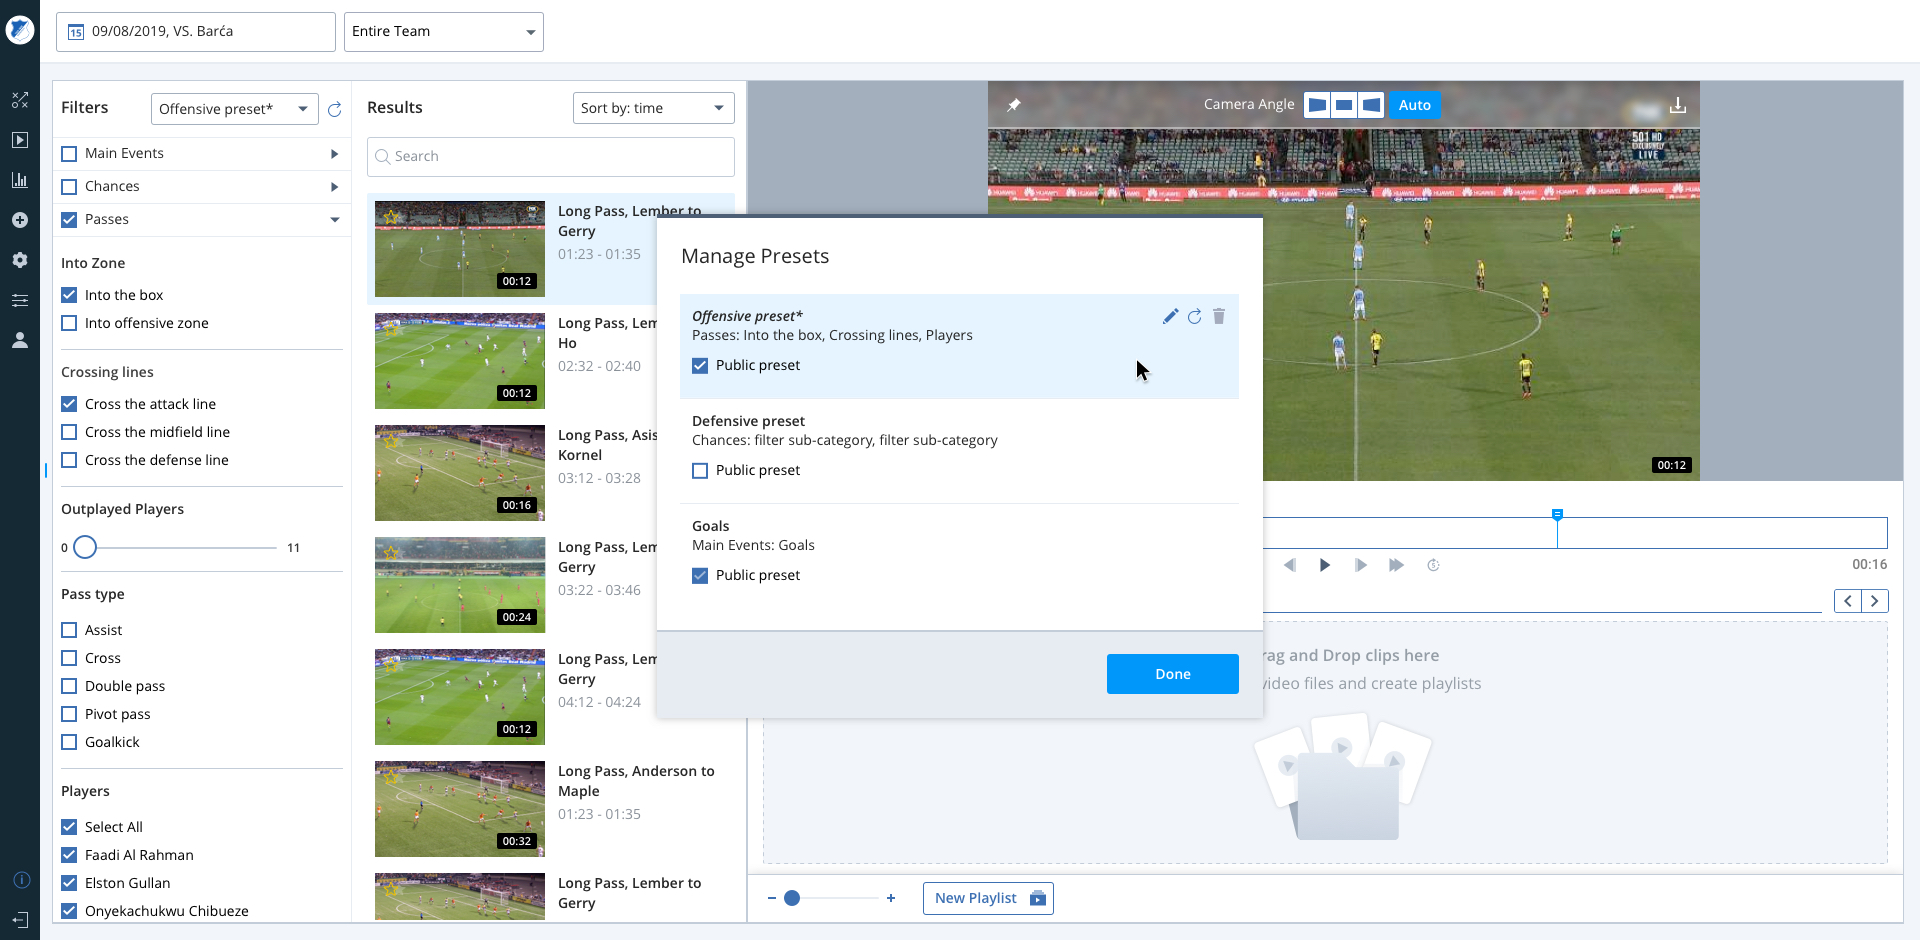
Video Analysis. Manage Presets Modal
Video Analysis. Creation New Playlist
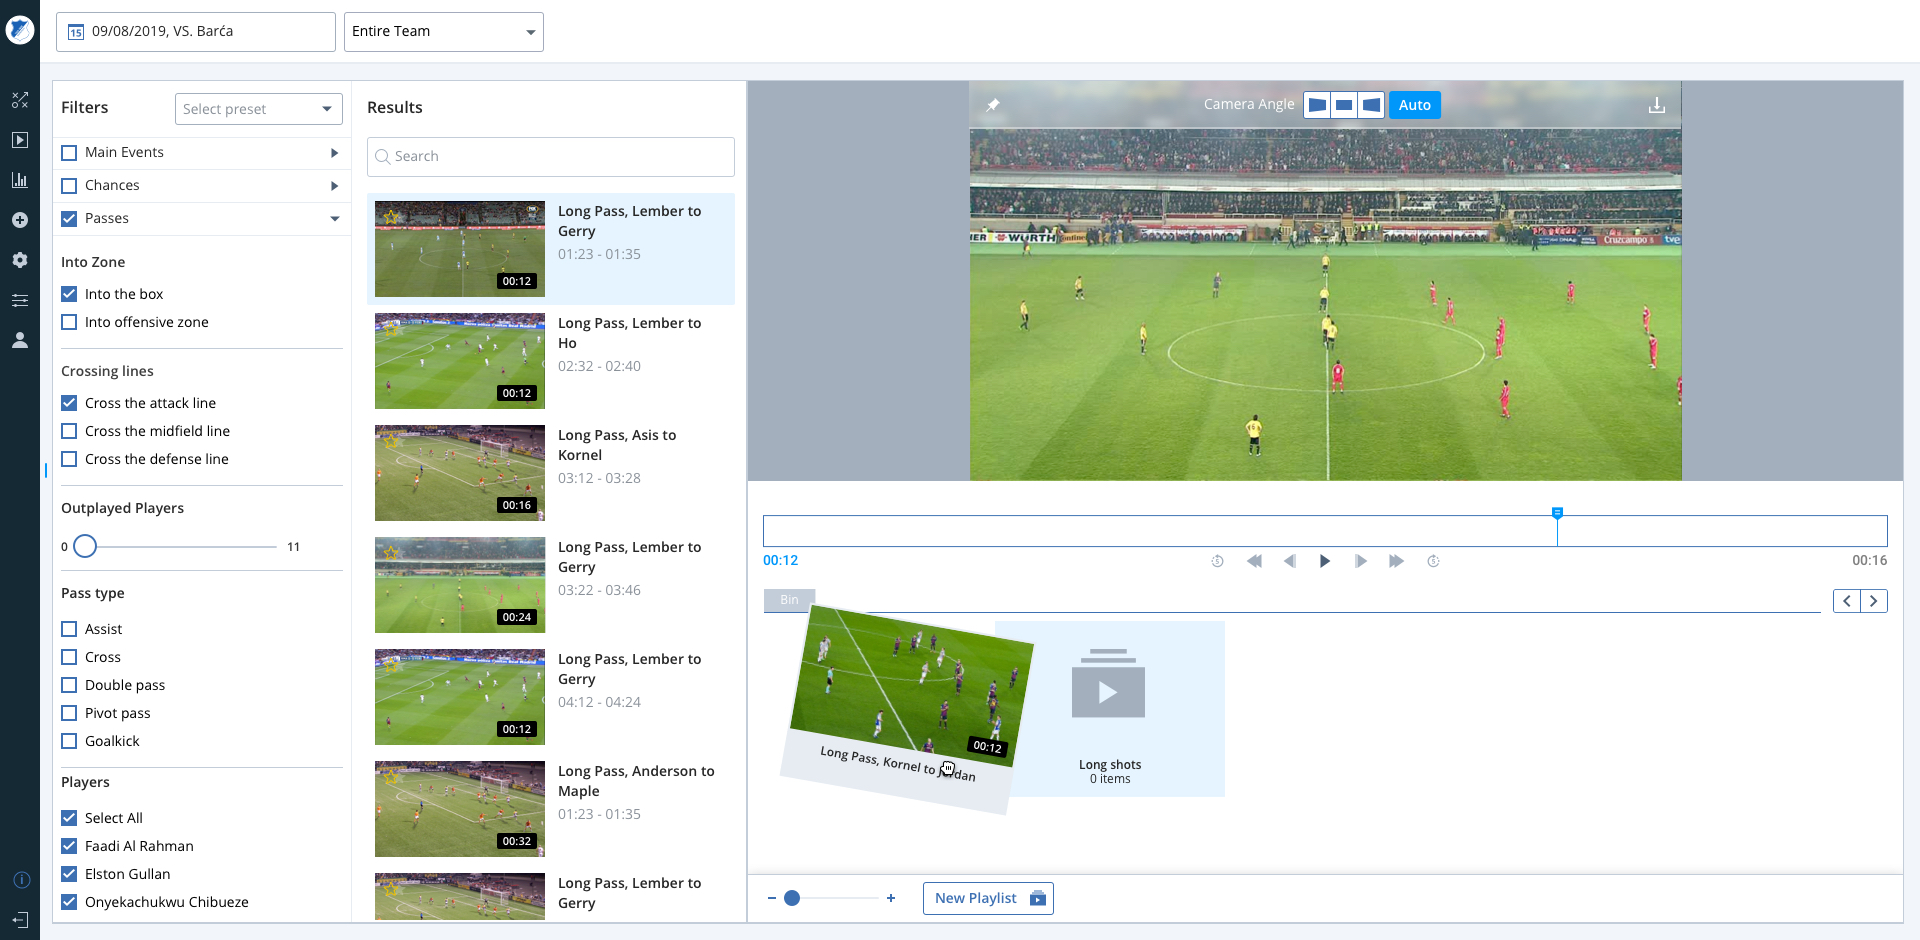
Video Analysis. Managing video clips with Drag and Drop action
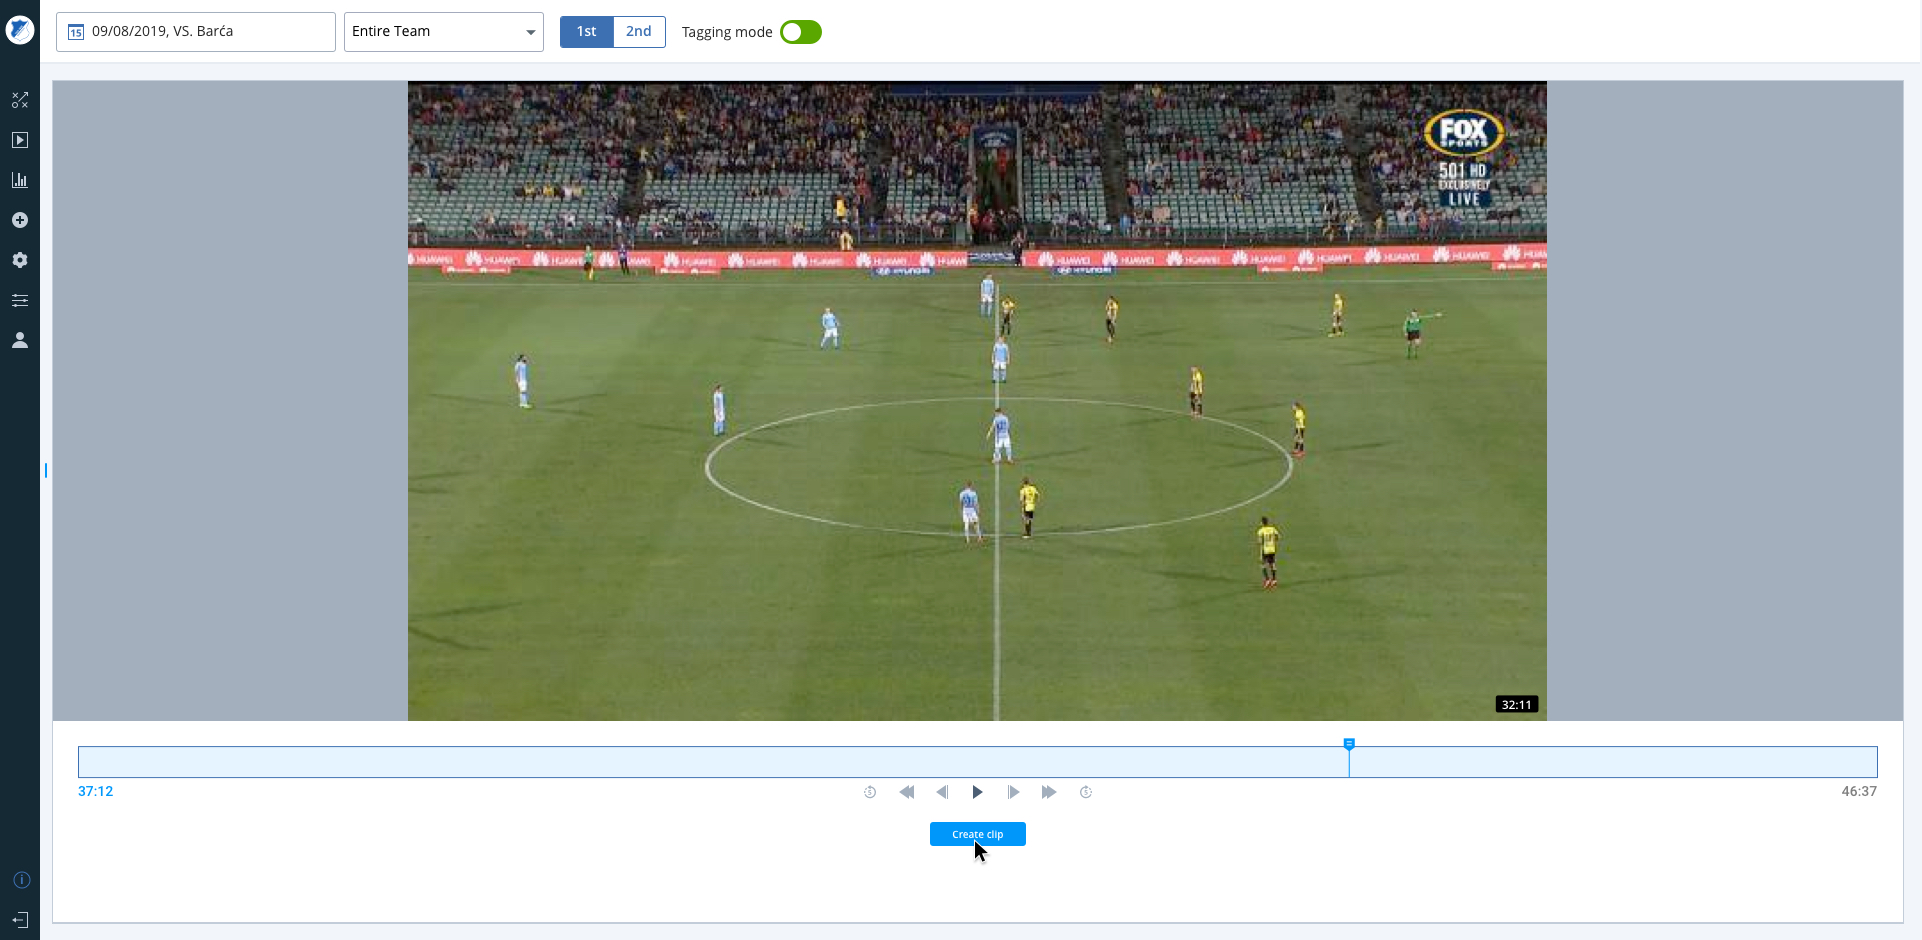
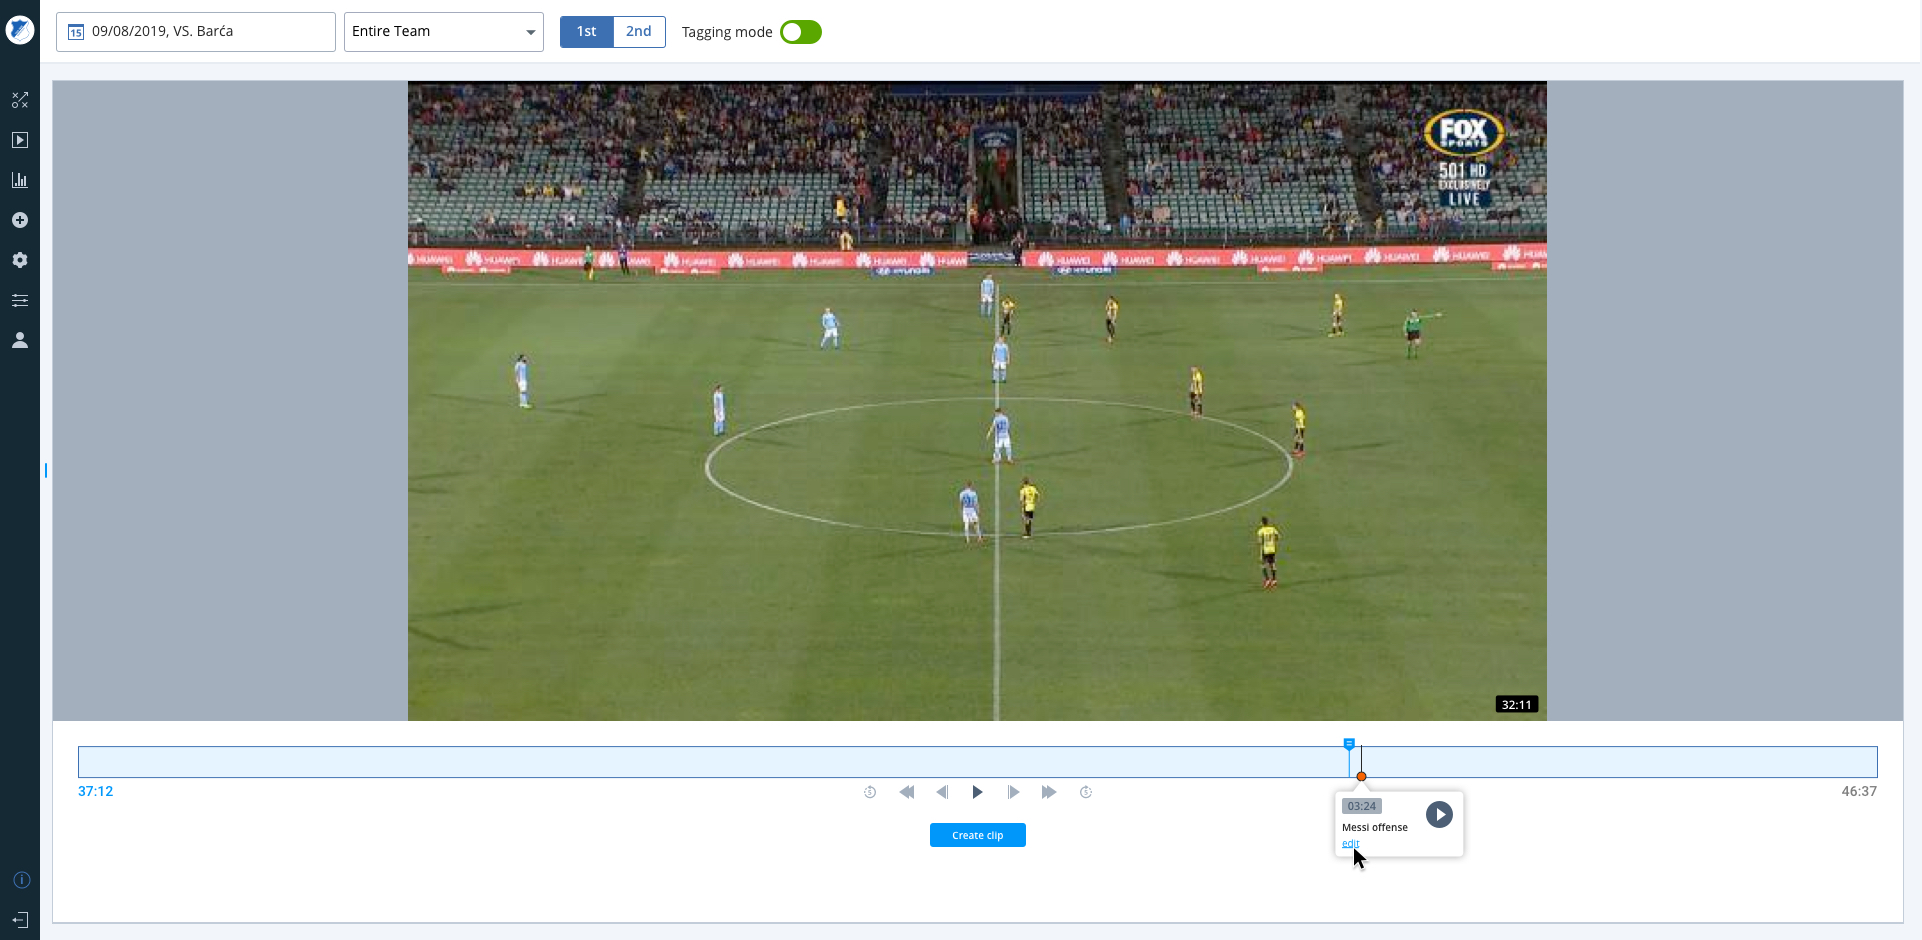
Custom designed and developed a player with manual editing, tagging, and video clip sorting.
Manual Clipping and Tagging. Create Clip
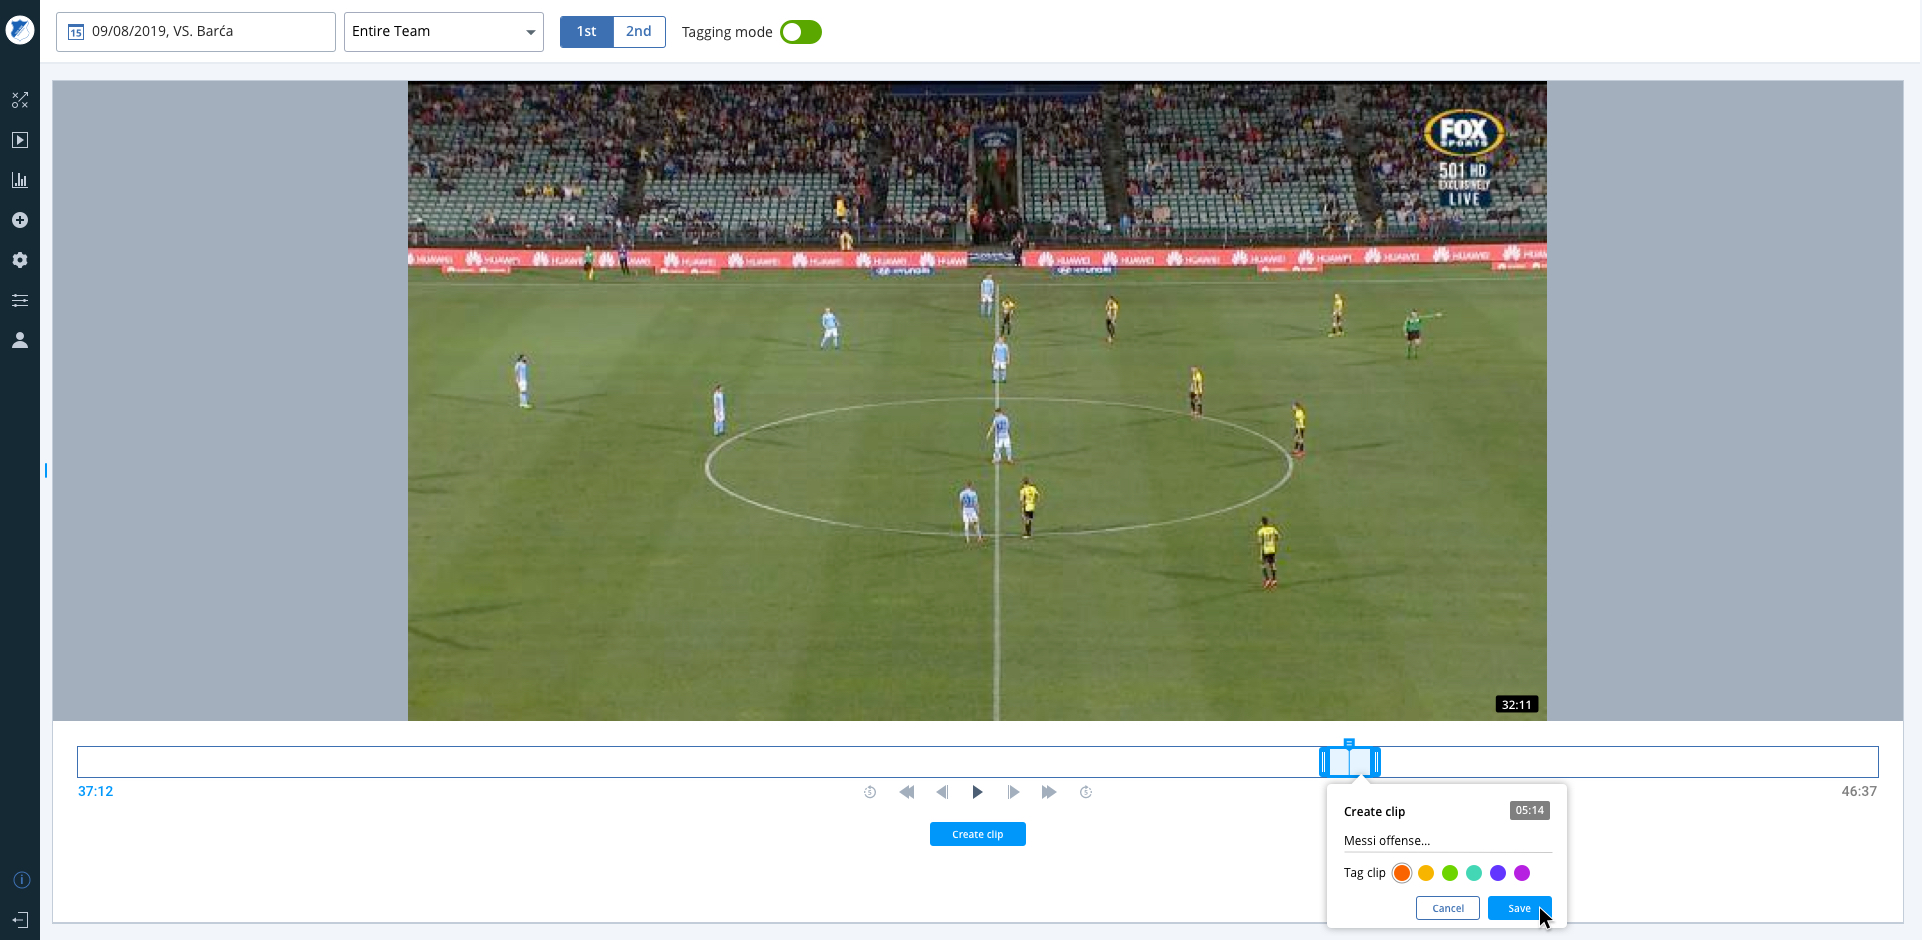
Manual Clipping and Tagging. Clip Editing
Manual Clipping and Tagging. Clip Tagging
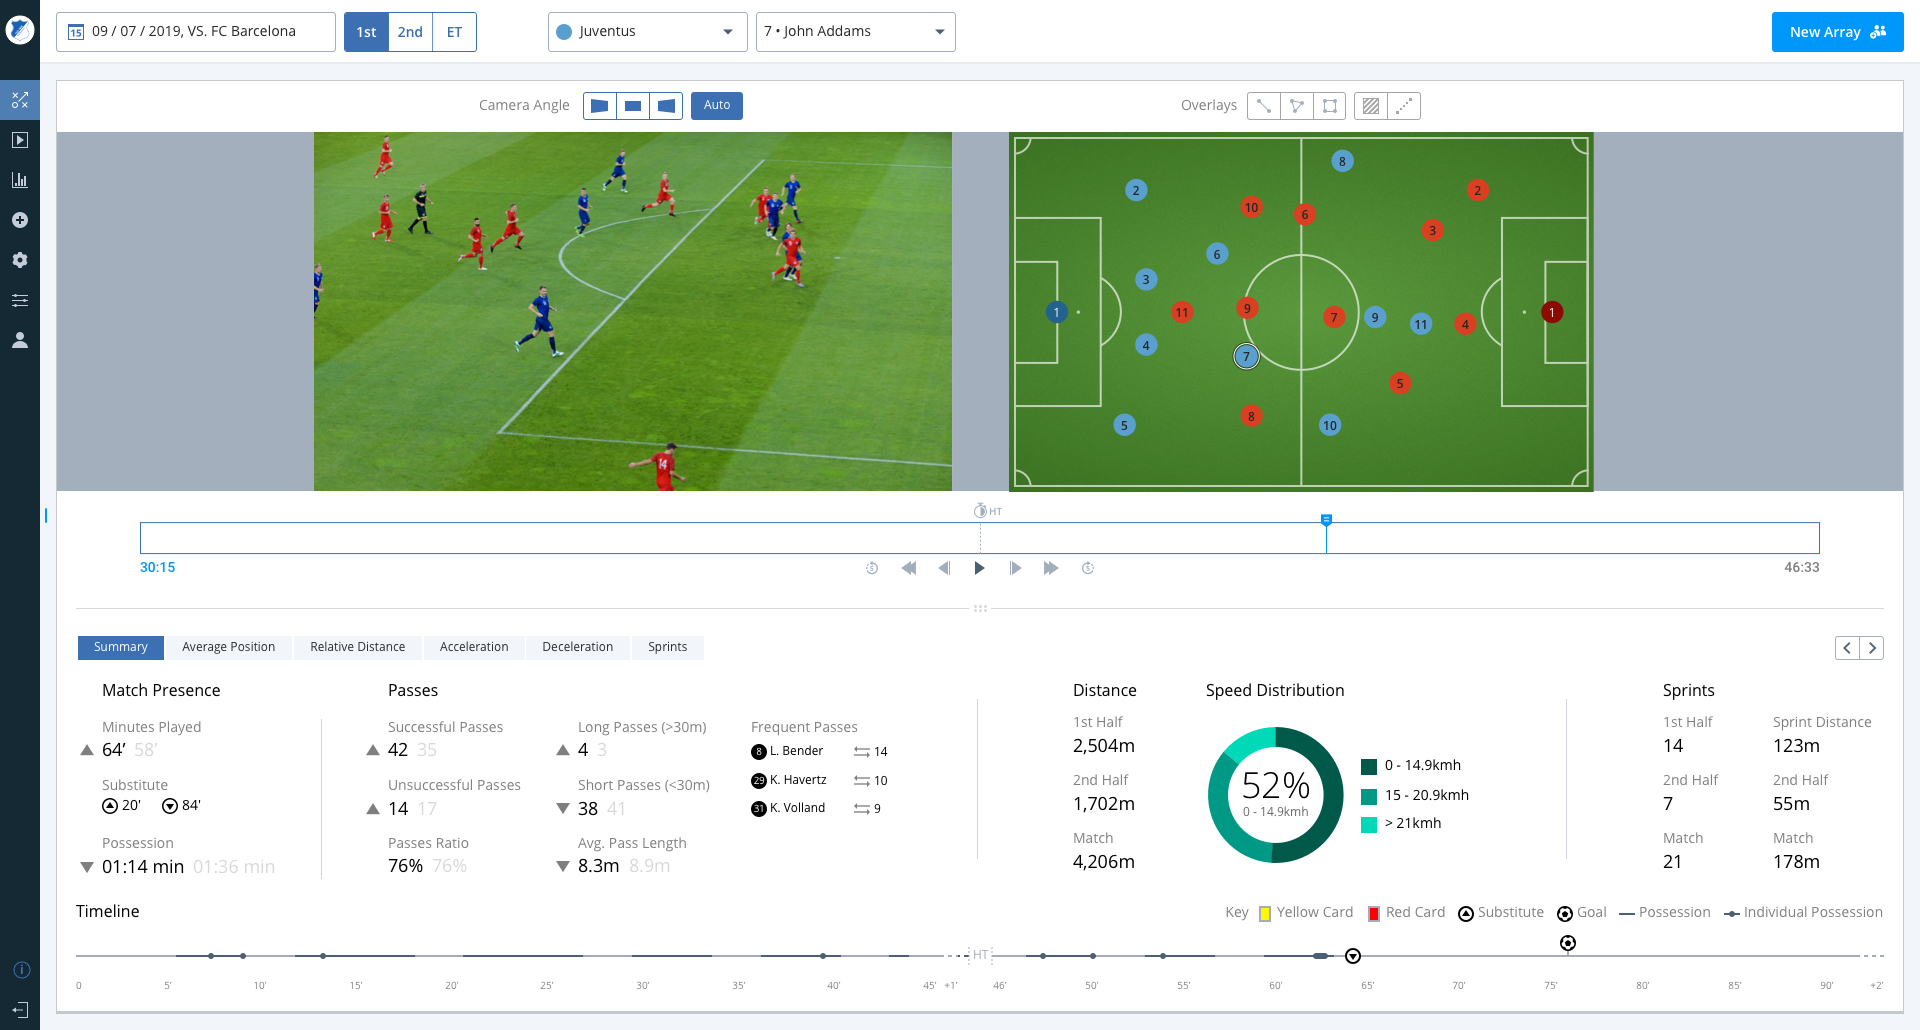
An example of Dynamic Tactical Viewer Screen with team summary, charts, and statistics.
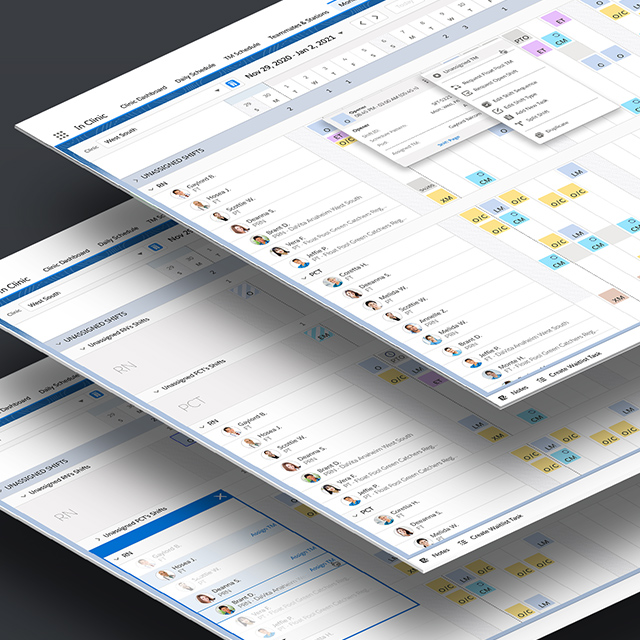
Adapting to mobile devices today is a must, so I also made the first version of the Track160 app 🙂